Type of resources
Available actions
Topics
Keywords
Contact for the resource
Provided by
Groups
Years
Representation types
Update frequencies
status
Service types
Scale
-

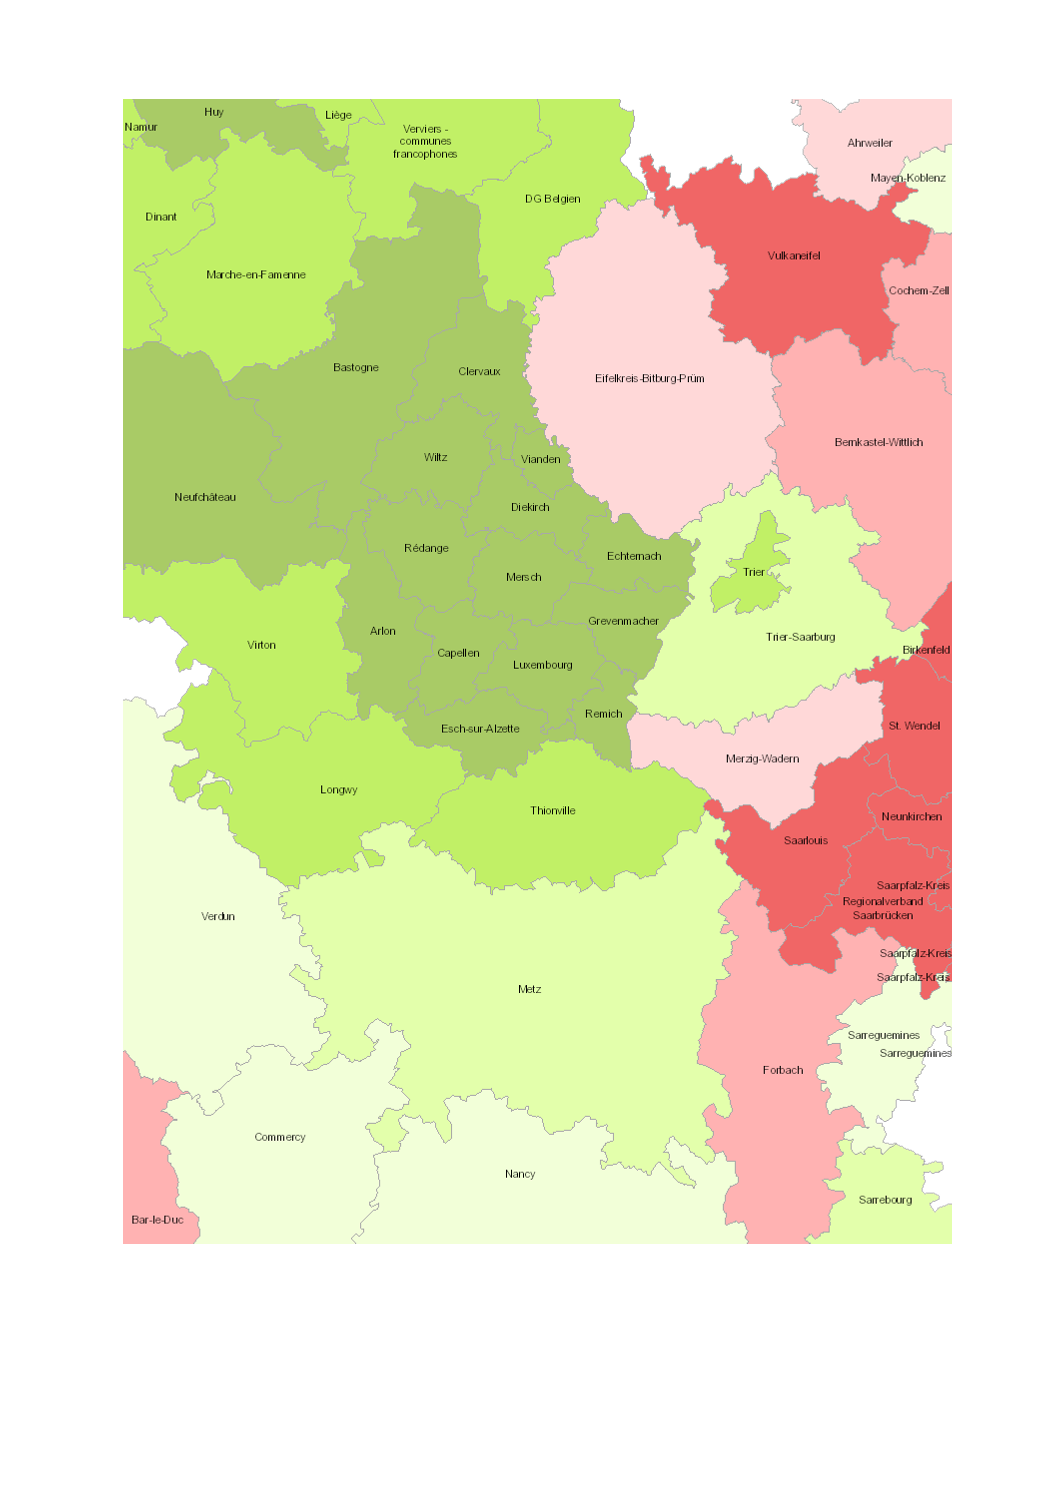
Change in total population 2000-2013 (zones d'emploi Lorraine: 1999-2011) - Territorial entities: arrondissements (Wallonie), zones d'emploi (Lorraine), cantons (Luxembourg), Kreise (Saarland, Rheinland-Pfalz) - Statistical data sources: INSEE Lorraine; SPF Economie; STATEC; Statistisches Landesamt Rheinland-Pfalz; Statistisches Amt Saarland. Calculations: IBA / OIE 2014 - Geodata sources: EuroGeographics EuroRegionalMap v3.0 - 2010. Harmonization: SIG-GR / GIS-GR 2014
-

Projection of working age population (20-64 years) 2013-2040 - Territorial units: arrondissements (Wallonie), départements (Lorraine), Grand-Duché (Luxembourg), Kreise (Saarland, Rheinland-Pfalz) - Statistical data sources: Eurostat; INSEE Grand Est; Statec; SPF Economie; BFP-DGSIE; Statistisches Landesamt Rheinland-Pfalz; Statistisches Amt Saarland. Calculs: OIE/IBA 2016 - Geodata sources: EuroGeographics EuroRegionalMap v9.1 - 2016. Harmonization: SIG-GR / GIS-GR 2016
-

Projection of working age population (20-64 years) 2010-2040 - Territorial units: arrondissements (Wallonie), départements (Lorraine), Grand-Duché (Luxembourg), Kreise (Saarland, Rheinland-Pfalz) - Statistical data sources: Eurostat; INSEE Lorraine; Statec; SPF Economie; BFP-DGSIE; Statistisches Landesamt Rheinland-Pfalz; Statistisches Amt Saarland. Calculs: OIE/IBA 2014 - Geodata sources: EuroGeographics EuroRegionalMap v3.0 - 2010. Harmonization: SIG-GR / GIS-GR 2014
-

Share of the working age population (20-64 years) in total population 2012 (Lorraine: 2011) - Territorial entities: arrondissements (Wallonie), zones d'emploi (Lorraine), Grand Duchy (Luxembourg), Kreise (Saarland, Rheinland-Pfalz) - Statistical data sources: INSEE Grand Est; SPF Economie; Statistisches Landesamt Rheinland-Pfalz; Statistisches Amt Saarland; STATEC. Calculations: OIE/IBA 2014 - Geodata sources: EuroGeographics EuroRegionalMap v3.0 - 2010. Harmonization: SIG-GR / GIS-GR 2014
-
Toutes les données publiées à travers ce services sont licencées sous CC0
-
Toutes les données publiées à travers ce services sont licencées sous CC0
-

Change in total population 2000-2015 (zones d'emploi Lorraine: 1999-2013) - Territorial entities: arrondissements (Wallonie), zones d'emploi (Lorraine), cantons (Luxembourg), Kreise (Saarland, Rheinland-Pfalz) - Statistical data sources: INSEE Grand Est; SPF Economie; STATEC; Statistisches Landesamt Rheinland-Pfalz; Statistisches Amt Saarland. Calculations: IBA / OIE 2016 - Geodata sources: EuroGeographics EuroRegionalMap v9.1 - 2016. Harmonization: SIG-GR / GIS-GR 2016
-
- European air quality index (based on pollutant concentrations in µg/m3): measurements over the last 100 days for each station - The sub-indices O3, PM10, PM2.5, NO2, and SO2 are available according to the type of station (industrial, background or traffic) in accordance with the methodology for calculating the European air quality index for the measuring stations throughout the Greater Region. - Data sources: ATMO Grand Est; Agence Wallonne de l'Air et du Climat - AWAC; Landesamt für Umwelt- und Arbeitsschutz Saarland - IMMESA; Landesamt für Umwelt Rheinland-Pfalz - ZIMEN; Administration de l'environnement Luxembourg. Harmonization: ATMO Grand Est and GIS-GR 2020
-
- European air quality index (based on pollutant concentrations in µg/m3): measurements over the last 3 days for each station - The sub-indices O3, PM10, PM2.5, NO2, and SO2 are available according to the type of station (industrial, background or traffic) in accordance with the methodology for calculating the European air quality index for the measuring stations throughout the Greater Region. - Data sources: ATMO Grand Est; Agence Wallonne de l'Air et du Climat - AWAC; Landesamt für Umwelt- und Arbeitsschutz Saarland - IMMESA; Landesamt für Umwelt Rheinland-Pfalz - ZIMEN; Administration de l'environnement Luxembourg. Harmonization: ATMO Grand Est and GIS-GR 2020
-
- European air quality index (based on pollutant concentrations in µg/m3): hourly measurements for the pollutant SO2 for the most recent hour for each station - The sub-index SO2 is available according to the type of station (industrial, background or traffic) in accordance with the methodology for calculating the European air quality index for the measuring stations throughout the Greater Region. - Data depth: The most recent index for the last 3 hours for each station is available hourly. If the calculation of the sub-index is not possible due to lack of data, its value is marked by a grey dot in the symbology of the map (data not available). - Data sources: ATMO Grand Est; Agence Wallonne de l'Air et du Climat - AWAC; Landesamt für Umwelt- und Arbeitsschutz Saarland - IMMESA; Landesamt für Umwelt Rheinland-Pfalz - ZIMEN; Administration de l'environnement Luxembourg. Harmonization: ATMO Grand Est and GIS-GR 2020
 geocatalogue.geoportail.lu